
Original data gets cited because no substitute source exists. If you are the only organisation that measured something, a model answering a question about it has one option.
Every other content advantage can be copied. A competitor can write a better guide, build a more thorough comparison page, produce more use-case content. They cannot produce your data, because they do not have your customers, your usage patterns or your vantage point.
This makes it the most durable citation advantage available and the most underused, because it requires actual work rather than more writing.
A second, less obvious benefit: Original data is the most reliable route to earned third-party coverage in B2B. Journalists and trade publications need statistics. Supply them and you get cited in the roundups and articles that feed AI answers, which multiplies the effect well beyond your own domain.
What counts as original data for a B2B company?
Five types, and most companies already have the raw material for at least two:
1. Aggregated product usage patterns:
What your customers actually do, anonymised and aggregated.
“Across 1,400 accounts, teams that completed onboarding within 14 days had a 34% higher 12-month retention rate than those taking over 30 days.”
You are sitting on this. Nobody else can produce it. It requires an analyst afternoon, not a research budget.
The constraint: Aggregate properly, never identify individual customers, and check your terms of service permit aggregate analysis. Most do; confirm rather than assume.
2. Customer or category surveys:
A structured survey of your customers, or of your category more broadly.
Sample size matters less than honesty about it. A survey of 180 practitioners, clearly described as such, is citable. The same survey presented as “the state of the industry” is not, and will be discounted by anyone who checks.
Cost: A survey tool, a few hours writing questions, an email to your list. Under a day of work for most companies.
3. Benchmarks:
What typical performance looks like across your user base.
“The median field service team completes 4.2 jobs per technician per day. The top quartile completes 6.1.”
Benchmarks are unusually citable because they answer a question every buyer has are we normal? and because they get referenced repeatedly over years rather than once
4. Systematic testing you have run:
Something you tested methodically and recorded.
For an agency in this space, the obvious example is running a fixed set of buyer prompts across many categories and recording which vendors get cited and from which sources. Three or four hours of work producing a dataset nobody else has.
The same logic applies in any category: test something in your domain systematically, record it properly, publish it.
5. Longitudinal observations from client work:
Patterns across many engagements, anonymised.
“Across 40 B2B software companies audited, 31 had no comparison content of any kind, and 12 had AI crawlers blocked in robots.txt without having decided to.”
Weaker than controlled data, and it should be labelled as observation rather than research. Still valuable, because it is specific and nobody else has your sample.
How do you make data citable?
State the method plainly, present findings as clear self-contained sentences, and do not overstate what the data shows.
State the method:
Sample size, time period, how it was collected, what was excluded. Data without method is discounted, and any reader who wants to check will ask.
“Based on anonymised usage data from 1,400 accounts active between January and December 2025. Accounts with fewer than 5 users were excluded. Retention measured at 12 months from account creation.”
Four sentences. This is what separates a citable statistic from a marketing claim:
Present findings as extractable sentences:
A chart with no accompanying sentence cannot be cited. Every finding needs a plain-language statement.
Not citable: A bar chart titled “Onboarding speed vs retention.”
Citable: “Teams completing onboarding within 14 days had 34% higher 12-month retention than those taking over 30 days, across 1,400 accounts.”
Include both. The chart serves human readers; the sentence serves extraction.
Do not overstate:
This is where most data-led content marketing goes wrong, and where the credibility is either built or lost.
Overstated: “New research reveals that fast onboarding is the number one driver of SaaS retention.”
Honest: “In our data, onboarding speed correlated with retention. We cannot separate this from the possibility that engaged teams both onboard faster and retain better.”
The honest version is more likely to be cited, not less. Overstated claims get contradicted by other sources, and contradiction reduces the likelihood a model uses you. Hedged, qualified claims survive cross-referencing.
Publish the underlying numbers:
Where you can, publish the dataset or a summary table. It invites verification, which builds credibility, and it gives other sources something to reference directly.
What makes data spread beyond your site?
Data spreads when it is specific, surprising, and easy to cite in one sentence.
Specific: “34% higher retention” travels. “Significantly better outcomes” does not.
Surprising, or at least non-obvious: Data confirming what everyone assumed gets read and forgotten. Data that complicates a common assumption gets referenced.
Citable in one sentence: A journalist or a roundup writer needs a single statistic with a clear attribution. If your finding requires three sentences of setup, it will not be used.
Recent, with a visible date: Data from 2021 is discounted. Date everything and consider annual repeats a benchmark published yearly becomes a reference point, which is worth considerably more than a one-off study.
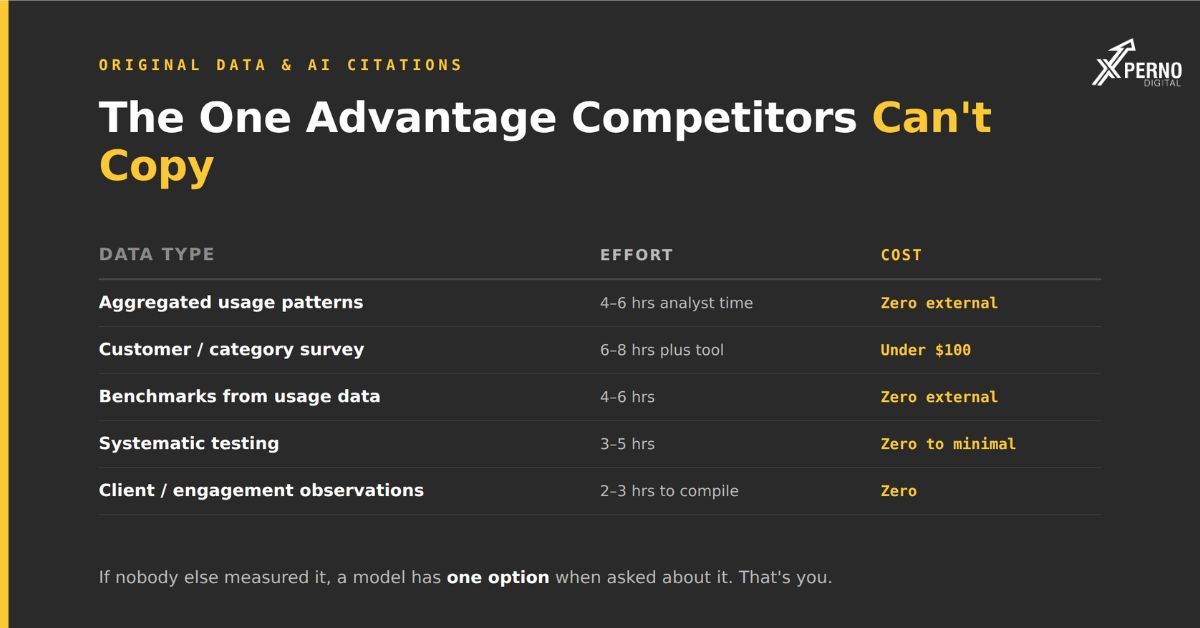
How much does this cost?
Most B2B companies can produce citable original data for under a day of work, using data they already hold.
- Type: Effort Cost
- Aggregated usage data: 4–6 hrs analyst time Zero external.
- Customer survey: 6–8 hrs plus tool Under $100.
- Benchmarks from usage data: 4–6 hrs Zero external.
- Systematic testing: 3–5 hrs Zero to minimal.
- Client observations: 2–3 hrs to compile Zero.
Compare that to a month of blog production, which for most teams is 16–20 hours and produces content that restates the consensus.
The reason it does not happen is not cost. It is that it requires someone to pull data, think about what it means, and be willing to publish a number they can be held to. That is a different activity from writing, and it usually falls between marketing and product with neither owning it.
Assign it explicitly. One person, one dataset, one quarter.
How often should you publish it?
Once a quarter is enough. One good dataset outperforms twelve blog posts.
Each piece of original data has a long life. It gets cited for years, referenced by third parties, and can be updated annually to become a recurring reference point.
A realistic annual programme:
Q1. An annual benchmark from usage data.
Q2. A customer survey on a specific question.
Q3. Systematic testing in your domain.
Q4. The year in review, aggregating observations across client or customer work.
Four pieces a year, each roughly a day of work. That is less effort than a month of blog publishing and produces the only content asset your competitors genuinely cannot replicate.
Frequently Asked Questions:
What if I don’t have enough customers to produce data?
Survey your category rather than only your customers. Or run systematic testing that requires no customer base at all, only a method and a few hours.
How large does a sample need to be?
There is no threshold. What matters is stating the sample honestly. 180 respondents described as 180 respondents is citable; 180 described as “the industry” is not.
Can I use data from a third-party tool?
Data you gathered using a tool is yours. Data the tool published is theirs, and citing it makes them the source rather than you.
Won’t publishing usage data expose commercially sensitive information?
Aggregate and anonymise. Publish patterns, not customer identities or absolute revenue figures. Check your terms of service permit aggregate analysis.
How do I get journalists to use my data?
Make it specific, recent, and citable in one sentence. Publish the method. Approach publications that already cover your category, ideally ones you found in your own citation analysi
Is a survey of 200 people worth publishing?
Yes, if described accurately. Small samples honestly labelled are more credible than large samples with unstated methodology.