
Leading indicators move before results and tell you whether the work is progressing. Lagging indicators confirm results after the fact, by which point the decisions that produced them are months old.
In a channel where the full effect takes six to twelve months, this distinction determines whether you can manage the work at all.
The problem it solves: If you judge GEO only by pipeline contribution, you get your first meaningful signal in month six or later. That is far too late to correct course, and it is why teams abandon the work in month three they have no evidence either way and interpret the absence as failure.
What are the lagging indicators?
Four, and all of them confirm rather than predict:
- Indicator Lag What it tells you?
- Pipeline contribution from organic: 4–9 months Whether it worked commercially
- Closed revenue attributed to organic: 6–12 months Same, later
- Branded search volume: 3–6 months Whether awareness grew
- Organic traffic: 3–6 months Weakest dominated by returning visitors
These are what you report to a board and what justify the budget. They are also useless for deciding what to do next month.
Organic traffic deserves particular scepticism. It is dominated by branded and returning visits, which mask changes in new discovery. Traffic can hold steady while the thing you were working on succeeds or fails entirely.
What are the leading indicators?
Six, in the order they typically move:
1. Output completed (weeks 1–8):
Not a metric in the usual sense, but it is the only evidence available in the first two months.
Pages built, technical fixes made, outreach approaches sent, review requests automated. If the work is happening and nothing has moved yet, that is expected. If the work is not happening, you know in week three rather than month four.
2. Appearance rate on specific queries (weeks 8–14):
The first real signal. Alternatives queries and direct brand queries move before anything else.
What to watch?: movement on three to six prompts out of twenty, concentrated in the narrow queries. Broad category queries unchanged is normal at this stage.
3. Share of voice (weeks 10–16):
Moves shortly after appearance rate and is the more honest number, because it controls for category-wide movement.
4. Source citations (weeks 8–20):
Whether your pages appear in Perplexity’s cited sources for your category prompts. This is the most direct evidence that your content work specifically is being picked up.
Why it is useful early?: It can move before you appear in the answer itself. Being cited as a source without being named as a vendor is a partial signal, and it comes earlier than full inclusion.
5. Review velocity (weeks 4–24):
Reviews per month. An input you control directly, moving well before the visibility effect it produces.
6. Third-party mentions (months 3–6):
Roundup inclusions, articles, corrections landing. The slowest leading indicator and the one that predicts the largest eventual effect.
In what order do they move?
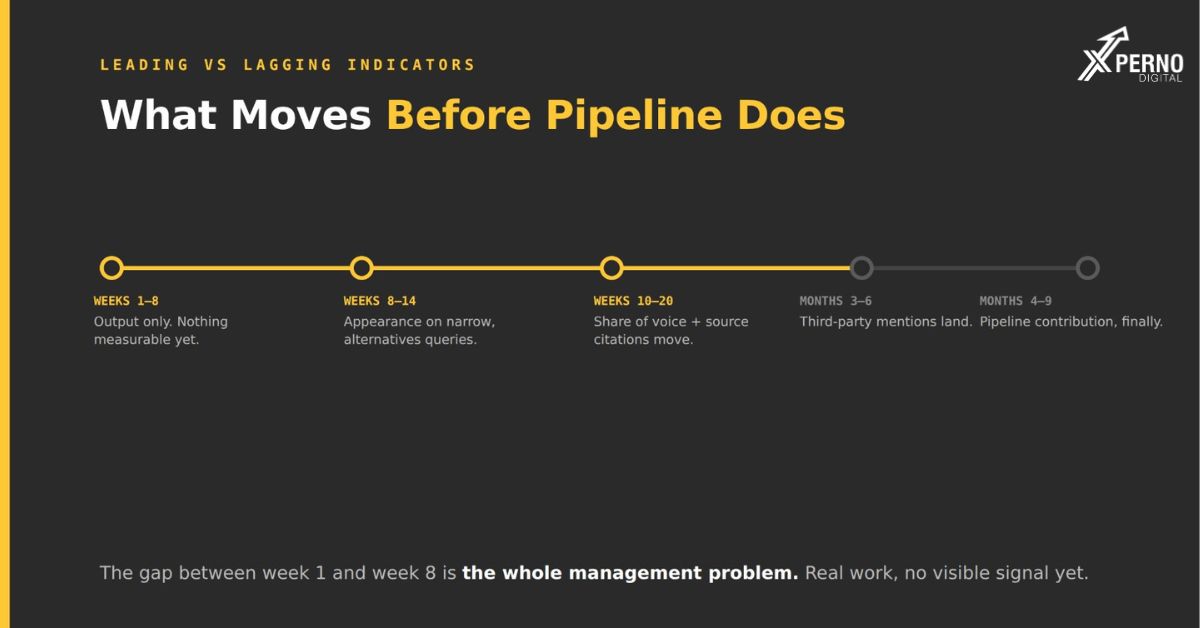
Output first, then narrow-query appearance, then share of voice, then broad queries with off-site indicators running in parallel on a longer timeline
- Timeline What moves?
- Weeks 1–8 Output only. Nothing measurable.
- Weeks 8–14 Appearance on alternatives and direct brand queries
- Weeks 10–16 Share of voice begins moving
- Weeks 8–20 Your pages appear in cited sources
- Weeks 4–24 Review velocity accumulates
- Months 3–6 Third-party mentions land
- Months 4–9 Pipeline contribution becomes visible
- Months 6–12 Broad category queries, in categories where they are winnable
The gap between weeks 1 and 8 is the whole management problem. Real money is being spent, real work is being done, and no indicator has moved. Knowing in advance that this phase exists is what prevents a reasonable person concluding the work has failed.
How do you use these to make decisions?
Set expected movement for each indicator in advance, then check against it rather than against a general sense of progress
A workable decision framework:
- Check at Expect If it hasn’t moved
- Week 4 Output on schedule The work is not happening. Escalate.
- Week 10 Source citations beginning Check crawler access and page indexation
- Week 14 Appearance rate up on narrow queries Check whether pages contain specific facts, not adjectives
- Week 20 Share of voice moving Check competitor activity they may be gaining faster
- Month 4 Third-party mentions landing Off-site work was probably skipped
- Month 6 Pipeline contribution visible Reassess whether organic is the right channel
The value of writing these down before starting is that it converts “is this working” from a judgement call into a check. It also removes the incentive to reinterpret flat numbers favourably.
Which indicator should you lead reporting with?
Share of voice, because it moves early enough to be actionable and reflects competitive position rather than activity.
A reasonable reporting hierarchy:
1. Share of voice and the competitive gap the headline
2. Where you gained by query type shows the pattern is normal
3. Pipeline contribution the commercial number, with its attribution method stated
4. Output completed deliverables, not hours
5. Everything else in an appendix
What not to lead with?: Traffic, rankings, impressions or activity counts. All of them either lag badly or measure the wrong thing.
What are the limits?
Leading indicators predict imperfectly, and treating them as guarantees is its own failure mode.
Four honest caveats:
Movement on narrow queries does not guarantee pipeline. You can gain visibility on queries that do not convert. Check that the queries moving are ones your buyers actually ask.
Output is not progress: Six pages built is not six pages working. Output is the earliest available evidence, not evidence of effect.
Output is variable: These systems produce different answers on different runs. Movement of a few percentage points is within the margin, and three runs per prompt reduces noise without removing it.
Attribution stays imperfect throughout: If share of voice rises, you cannot cleanly separate your work from a competitor’s decline or a third-party article that happened to include you.
None of this makes them worthless: It makes them directional which is considerably better than the alternative, which is six months of no information followed by a lagging number that arrives too late to act on.
Frequently Asked Questions:
What is the earliest indicator of GEO working?
Your pages appearing in Perplexity’s cited sources, typically weeks 8–20. It can move before you appear in the answer itself.
How long before I should worry?
If nothing has moved on narrow queries by week 14, check the basics crawler access, indexation, and whether your pages contain specific facts rather than adjectives.
Should I report leading indicators to a board?
Lead with share of voice and pipeline contribution. Keep the rest available but do not fill a board report with early signals a non-specialist cannot interpret.
Why does traffic lag so badly?
It is dominated by branded and returning visits, which mask changes in new discovery. It can stay flat while the underlying position changes substantially in either direction.
Can leading indicators be gamed?
Output counts can. Appearance rate and share of voice are harder to inflate because they are measured against competitors in a system neither party controls.
What if leading indicators move but pipeline does not?
Check whether the queries gaining visibility are ones your buyers actually ask. Visibility on the wrong queries produces no pipeline.